Portfolio Overview
Singapore
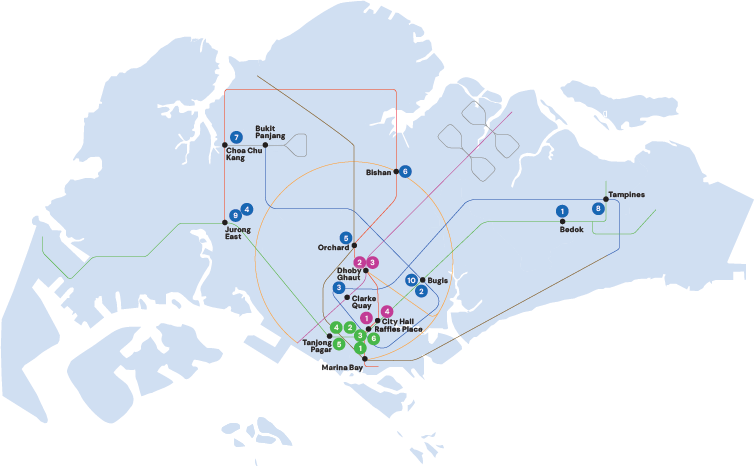
Retail
Office
Sydney, Australia
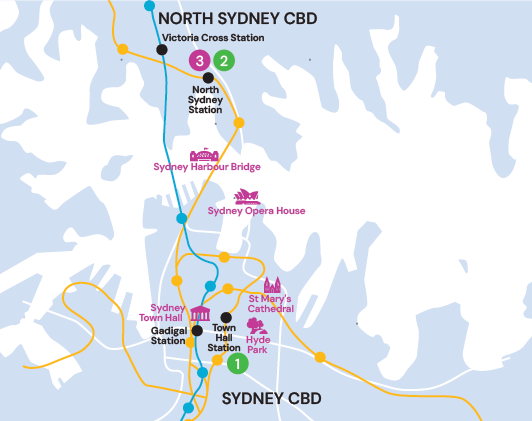
Sydney, Australia
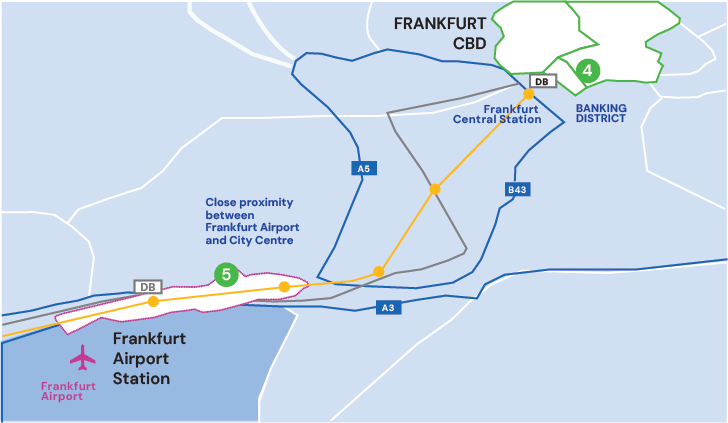
Frankfurt, Germany